One of the most frequently asked questions we get when evaluating PSA campaigns, is how are we doing? The simple, but not helpful way to answer the question is to respond: “compared to what?” While it is a simplistic response, it forms the backdrop for the need to compare any non-profit PSA campaign to a standard.
Our Evaluation Process
One of our newest PSA evaluation procedures is aptly titled: “Benchmark Report,” because it compares any given client campaign to 64 national TV broadcast PSA campaigns we have distributed since 2010. The reason for beginning in this year is because that is when most TV stations migrated to “Hi-Def.” As part of that process, each station got up to six sub-channels, many of which are used to air PSAs. This fact, in turn has resulted in a very significant increase in our client campaigns from 2010 onward.
Using the benchmark data, our software computes an average of these campaigns, against which the client campaign is compared. To keep the data uniform for comparison, we select similar tracking periods, and we use only data resulting from the Nielsen SIGMA tracking service, which is the most accurate available.
The real reason why this is a valuable exercise is not just to see how well any given campaign is performing against the standard; it is to do this analysis early in the months after the campaign was distributed. We think the answer to why we do this is obvious, but just in case it is not, if you wait until the campaign has run its course, it is too late to affect change.
Other Near-Term Measurement Tools
As the campaign is maturing, we have two other tools to give our clients a clear picture of how well their campaign is performing:
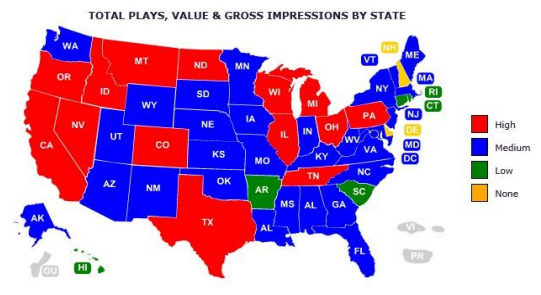
Geographic Map
Looking at PSA usage data as part of a long list of stations, frequency of usage, etc. is not all that intuitive. But looking at a U.S. map that shows where you are getting PSA exposure, according to four levels of usage definitely is.

Network Report
Another report that is part of our suite of evaluation procedure is a network report which isolates TV network usage from all other local exposure. This is important because we typically use our TV outreach specialist to contact networks and we need to be able to document the effectiveness of that process.
Merchandising Your Data
You paid a lot of money to produce, promote, distribute and track your PSAs, so why not merchandise your reports to all of those who have anything to do with developing your brand image, including:
- Senior management
- Marketing staff
- Donors/corporate supporters
- Your chapter networks
- Your ad/PR agency staff
In our non-profit PSA workshops, we always include a Powerpoint slide that says the following:
“PSA evaluation for the sake of data collection is a
meaningless exercise.
It is what you do with the data to affect a more positive
outcome that is important.”


Leave A Comment